Measuring Asteroid Rotation Periods with Backyard Photometry
Measuring Asteroid Rotation Periods from Your Backyard
Figuring out how fast an asteroid spins, using nothing but your own backyard setup, might be one of the most satisfying projects an amateur astronomer can take on. It’s real science. It feeds planetary defense catalogs that professionals actually rely on. And you don’t need anything exotic, just a modest telescope, a CCD or CMOS camera, and a willingness to be meticulous about your technique. Below is the full workflow: gear, imaging strategy, data reduction, and how to actually read the lightcurve once you’ve got one.
Why Measure Asteroid Rotation Periods?
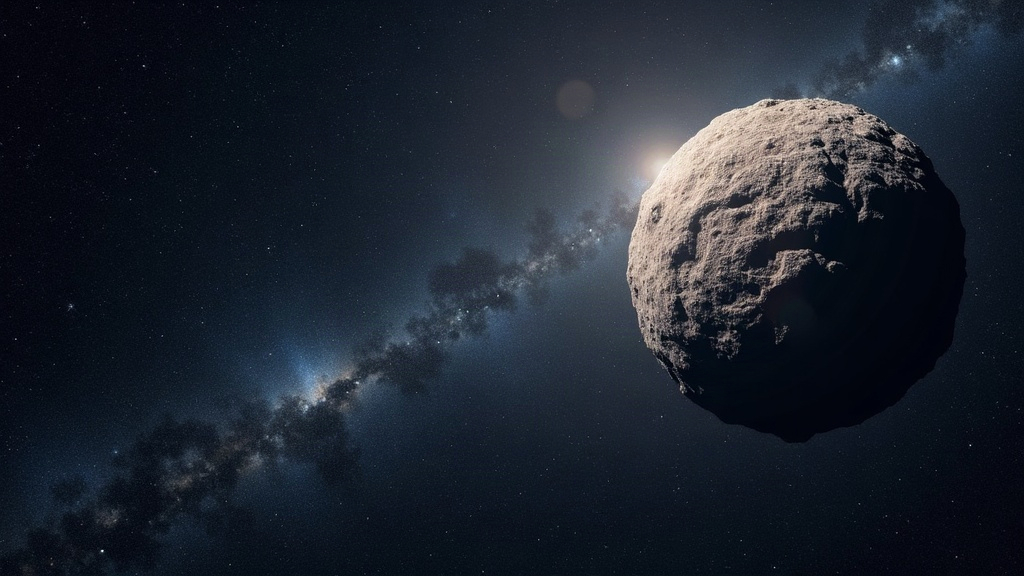
Here’s the basic physics of it. Most asteroids aren’t spherical, they’re lumpy, irregular chunks of rock tumbling end over end. As one tumbles, the amount of sunlight it throws back at Earth rises and falls depending on which face is pointed our way. That rise and fall, tracked over time, is called a lightcurve. Time it carefully enough and you can pull out:
- The rotation period itself (commonly anywhere from a few hours to a couple of days)
- A rough sense of how elongated the object is, based on how big the brightness swings are
- Hints of a binary companion, if the curve throws in an odd secondary dip you weren’t expecting
This isn’t just a personal exercise either. Data like this flows into the Asteroid Lightcurve Database (LCDB) and projects run through the Minor Planet Center. A backyard observation, done right, can end up in a professional dataset.
Equipment You Actually Need
Forget the observatory dome. A workable setup looks something like this:
- Telescope: something in the 8 to 14 inch aperture range handles asteroids down to around magnitude 15-16 comfortably
- Camera: a cooled CCD, or a modern CMOS camera with low read noise, either works
- Mount: equatorial, and it needs to track accurately enough to hold 30-120 second exposures without drift
- Filter: a clear or luminance filter is enough for relative photometry; grab a V filter too if you plan to submit standardized data
- Software: AstroImageJ, MPO Canopus, or Tycho Tracker, any of these will get you through photometry and period analysis
Step 1: Target Selection
What makes a good target? Look for:
- An apparent magnitude that sits comfortably within what your scope can measure reliably (for a 10-inch, that usually means brighter than mag 15)
- A predicted rotation period under 12 hours, so you can realistically catch a full cycle in one or two nights rather than chasing it across a week
- A field that isn’t cluttered with nearby stars of similar brightness, since those tend to blend together and ruin your measurements
Before you commit, check the LCDB or the Minor Planet Center’s ephemeris tools. Make sure the object hasn’t already been nailed down by someone else. Picking an under-studied asteroid is where your observation actually adds something new.
Step 2: Imaging Strategy
Photometry lives or dies on consistency. A few rules worth following religiously:
- Keep exposure times fixed across the whole session. It makes calibration much simpler later.
- Set your cadence deliberately: a frame every 1-3 minutes usually works, though fast rotators demand tighter sampling so you don’t miss the peaks.
- Track the asteroid, not the background stars, if it’s moving fast enough that it would trail during a long exposure.
- Calibrate everything: darks, flats, bias frames, the same discipline you’d apply to any deep-sky image.
- Spread observations across multiple nights if the rotation period runs longer than a single dark window allows.
Step 3: Differential Photometry
Once the frames are calibrated, the next job is comparing the asteroid’s brightness against a handful of steady, non-varying stars sitting in the same field. This technique, differential photometry, cancels out the noise from atmospheric extinction and minor tracking errors that would otherwise muddy your results.
- Choose 3 to 5 comparison stars that roughly match the asteroid’s color and brightness
- Skip anything near the frame’s edge or with weak signal-to-noise
- Stick to aperture photometry, and keep the aperture radius identical across every single frame
Step 4: Building and Folding the Lightcurve
Plot magnitude against time and you’ll get your raw lightcurve, which, frankly, usually looks like noise at first glance. The fix is period folding: overlaying all your data points modulo a trial period to see whether they snap into a clean, repeating shape.
- Tools like MPO Canopus can automate the period search using Fourier methods, often a Lomb-Scargle periodogram
- Test a range of candidate periods and watch for the one that tightens the scatter when folded
- Most asteroid lightcurves show two peaks and two dips per rotation, since both elongated ends catch and reflect sunlight as the object spins
Common Pitfalls
- Aliasing: a short observing window can trick you into measuring a harmonic of the real period rather than the period itself. Cross-check against published values whenever they exist.
- Weather gaps: lose one night to clouds and you might end up with an ambiguous cycle count. Plan for at least three nights if you can.
- A bad comparison star: if your reference star turns out to be secretly variable, it quietly wrecks your entire dataset. Check it against AAVSO’s variable star catalogs before you trust it.
Submitting Your Data
Got a clean, folded lightcurve? Submit it to the Minor Planet Center, or reach out to groups tied to the IAU’s Asteroid Lightcurve Database. Just document things properly: observation dates, your equipment, the filter you used, and the final folded period with its uncertainty. That level of detail is what turns a hobbyist’s data into something a professional researcher can actually use.
Conclusion
Backyard asteroid photometry sits right at the intersection of careful technique and genuine scientific contribution. A modest telescope, a disciplined imaging cadence, and patient differential photometry are enough to produce lightcurves that hold up in professional databases. Pick a bright, under-characterized target, stay patient through the data reduction (it’s fiddlier than it sounds at first), and before long you’ll be adding real rotation measurements to a dataset the whole astronomical community draws from.